HTML

HTML

Rabu, 10 Oktober 2018

MHI Brookings Brief

MBB
MBB
U.S. President Donald Trump delivers remarks on the United States-Mexico-Canada Agreement (USMCA) during a news conference in the Rose Garden of the White House.

5 things to know about USMCA, the new NAFTA

Geoffrey Gertz discusses how the new trade agreement between the United States, Canada, and Mexico differs from its original version, the impact on U.S. interests in the long term, and the long road ahead to implementing the agreement., how does it differ from the old NAFTA, and what does it mean for U.S. trade policy going forward? Here are five things to know.
Hasil gambar untuk 5 things to know about USMCA, the new NAFTA
  1. Overall, the changes from the old NAFTA are mostly cosmetic. After a year and a half of negotiations, the three parties are going to end up with a new trade deal that looks remarkably similar to the old NAFTA. The main structure of the deal is largely intact; the biggest changes include higher rules-of-origin requirements for the auto sector, marginally greater U.S. access to the Canadian dairy market, and a scale-back of the investor-state dispute settlement (ISDS) rules. Thus we shouldn’t expect to see any dramatic economic effects from this deal—though if it convinces businesses’ that U.S. withdrawal from NAFTA is no longer on the table, resolving this uncertainty may lead to a small increase in investment.
  2. The most revealing change might be the agreement’s new name. The United States Trade Representative press release announcing the new deal referred to it as USMCA, an acronym for U.S.-Mexico-Canada Agreement. This is, obviously, a terrible, unpronounceable name—but the shift itself is telling. It hints at the true underlying motivation for this renegotiation—Trump’s desire to overhaul the sullied “NAFTA” brand. On the campaign trail, Trump had denounced NAFTA as the worst trade deal ever; the administration seems to hope a new name will help sell these minor revisions as a substantial improvement. Yet, even if one accepts the idea of renaming the deal, there were some better branding options available to the negotiators: either MUSCA or CAMUS, for instance, would be far more pronounceable than the mouthful “USMCA.” Of course, neither of these alternatives would literally put “America First” the way USMCA does—perhaps explaining why they were passed over.
  3. The Trump administration got at least part of what it wanted. Coverage of the final U.S.-Canada talks have suggested it was a compromise outcome—the U.S. succeeded in winning a (modest) opening of the Canadian dairy market, while Canada persevered in preserving the Chapter 19 dispute settlement system and its special protections for Canadian cultural industries. While it’s true this was a compromise relative to the negotiating positions of the two sides, when judged against the standard of the previously existing NAFTA it’s clear the U.S. got more of what it wanted. Canada’s “victories” consisted of maintaining the status quo in many important areas; but while actual changes to NAFTA were modest, they were almost uniformly in the direction of what the U.S. wanted, and away from what Canada and Mexico wanted. Trump’s aggressive, threatening approach succeeded in eliciting modest concessions from two of its closest trading partners.
  4. While this might be a (modest) short-term victory for the U.S., it risks undermining America’s long-term interests. The fact that both Mexico (on autos) and Canada (on dairy) took some small steps to appease Trump’s demands should not be surprising—the U.S. is more important to their economies than vice versa. Does this imply Trump was right all along, that previous American trade negotiators had been foolishly taken advantage of? Hardly. Indeed, while the U.S. gained a few minor, discrete achievements in these talks, Trump’s approach in the renegotiations have likely undermined broader long-term American interests. As a global power, the U.S. has sought to exert influence by investing in “soft power,” the ability to convince other countries their own interests in fact align with those of the U.S. In seeking to squeeze a few more dimes out of Canada and Mexico, Trump is telling America’s allies that they should no longer be so inviting of American power.Since Trump’s election, a number of U.S. allies have already taken steps to balance against U.S. power, and diversify their interests away from America. The U.S. approach to NAFTA’s renegotiation should only accelerate this trend. In other words, the important question was never whether the U.S. could shake down its trade partners to extract some modest gains, but rather whether it should. Mexico and Canada won’t forget how the U.S. treated them—and will readjust their plans accordingly, as will other countries that observed these talks. In the long run, this will undermine America’s influence in the world.
  5. There’s still a long way to go until USMCA becomes law. By announcing the new deal by the September 30 deadline, the three parties are still on schedule for an official signing ceremony before December 1st, current Mexican President Enrique Peña Nieto’s last day in office. But that’s the easy part. The difficult step will be ratifying the agreement, which in the U.S. will mean a vote sometime in the next Congress. Clearly, how such votes proceed will be significantly influenced by this fall’s midterm elections. Yet whatever happens, there are reasons why both Republicans and Democrats may be reluctant to approve the deal. Republicans in Congress are wary of Trump’s protectionist instincts; Democrats, meanwhile, are unlikely to actively help Trump realize one of his key campaign promises. Thus, USMCA’s congressional path remains unclear. (Of course, for their part, neither Canada nor Mexico will likely protest too strenuously if the U.S. fails to ratify the new pact, so long as it allows them to keep the existing NAFTA.).
Interactive-Middle-Class_Brief

Where does the American middle class live?

In a new analysis and interactive dashboard, Alan Berube examines patterns of growth and decline among the American middle class and the local factors that shape them across 382 metropolitan areas.
This report examines the presence of the middle class in America’s metropolitan areas, the collections of cities and surrounding suburbs that represent the nation’s regional economies. While there are few truly metropolitan governments in the United States, actors in many of the policy areas noted above work to influence economic opportunity at that scale. Looking across 382 metro areas, this analysis spotlights variation in the size of the middle class, factors associated with that variation, and trends in middle-class representation over time. It concludes with observations on the value of measuring middle-class size and status locally.
MEASURING THE METRO MIDDLE CLASS
One could measure the size of the middle class in metro areas in at least two ways:
  • Apply a uniform national definition of the middle class to data for metro areas. For instance, define the middle class as the middle 20 percent of the U.S. income distribution, then calculate the share of households in each metropolitan area who have incomes between the thresholds implied by that quintile.
  • Vary the definition of middle class for each metropolitan area based on its own middle, i.e., median. Many federal programs use 60 percent or 80 percent of a metropolitan area’s median income as a dividing line between low/moderate and middle income. One could calculate specific thresholds for each metro area based on its median income, then calculate the share of households with incomes between those thresholds.
HE MIDDLE CLASS IS LARGEST IN SMALL/MIDDLE-SIZED METRO AREAS
Gambar terkait
The nation’s 382 metropolitan areas had 280 million residents in 2017, representing six in seven Americans. Across those areas, the middle class varies in size from just over half of all households in Bloomington, Ill., to nearly three-quarters of households in Jacksonville, N.C.
Table1
Fig1Map1
METRO MIDDLE CLASS SIZES REFLECT LOCAL DEMOGRAPHIC AND INDUSTRIAL PATTERNS
Gambar terkait
Looking across all metropolitan areas suggests common local factors associated with having a larger—or smaller—middle class.
First, racial makeup relates to middle class size. Metro areas in which non-Hispanic whites account for a larger share of population tend to have larger middle classes (Figure 2). Such metro areas also have, on average, smaller low-income populations, and larger high-income populations. By contrast, metro areas with larger black populations tend to have smaller middle classes, and larger low-income populations. These patterns make sense given the strong, longstanding relationship between race and income in America. Notably, metro areas with larger Hispanic populations also have larger low-income populations, but middle classes of about the same size as other metro areas. Metro areas with large Asian populations, most of which are in California, have smaller middle classes and larger high-income household shares.
Fig2
Second, the types of industries that are prominent in a metro area are strongly associated with the size of its middle class. Metro areas where a larger share of the population works in retail, construction, administrative services, agriculture, manufacturing, and transportation have larger middle classes on average (Figure 2). These industries tend to provide decent-paying jobs for individuals who may not possess a four-year college degree, and who represent the bulk of the workforce in most metro areas. Conversely, metro areas where professional services, information, finance, and management industries predominate have relatively small middle classes, and considerably larger high-income populations. These are mostly large places like the San Francisco Bay Area, Washington, Boston, and Seattle, with significant numbers of highly paid workers. Consistent with the observation above about college towns, metro areas where more people work in higher education tend to have smaller middle classes, and larger low-income and high-income populations.
SMALL/MID-SIZED METRO AREAS HAVE EXPERIENCED LARGER CHANGES IN THE SIZE OF THEIR MIDDLE CLASSES 
Hasil gambar untuk Where does the American middle class live?
Under the definition employed here, the relative size of the U.S. middle class does not change over time; 60 percent of all households always have incomes in the middle three quintiles of the income distribution. Because about 86 percent of Americans live in metropolitan areas, the collective size of their middle class also does not change much over time. The share of all households in metro areas classified as middle class was 60.2 percent in 2017, down just slightly from 60.7 percent in 2000.
The middle-class share in metro areas dropped slightly because they gained somewhat more high-income households over the past decade and a half. The 382 U.S. metro areas added (on net) roughly 13.5 million households from 2000 to 2017. Of those, 8.0 million (57 percent) had middle-class incomes, 3.4 million (25 percent) had incomes in the adjusted top national quintile, and 2.6 million (18 percent) had incomes in the adjusted bottom national quintile. Put another way, metro areas overall became a little bit wealthier compared to the rest of the country.
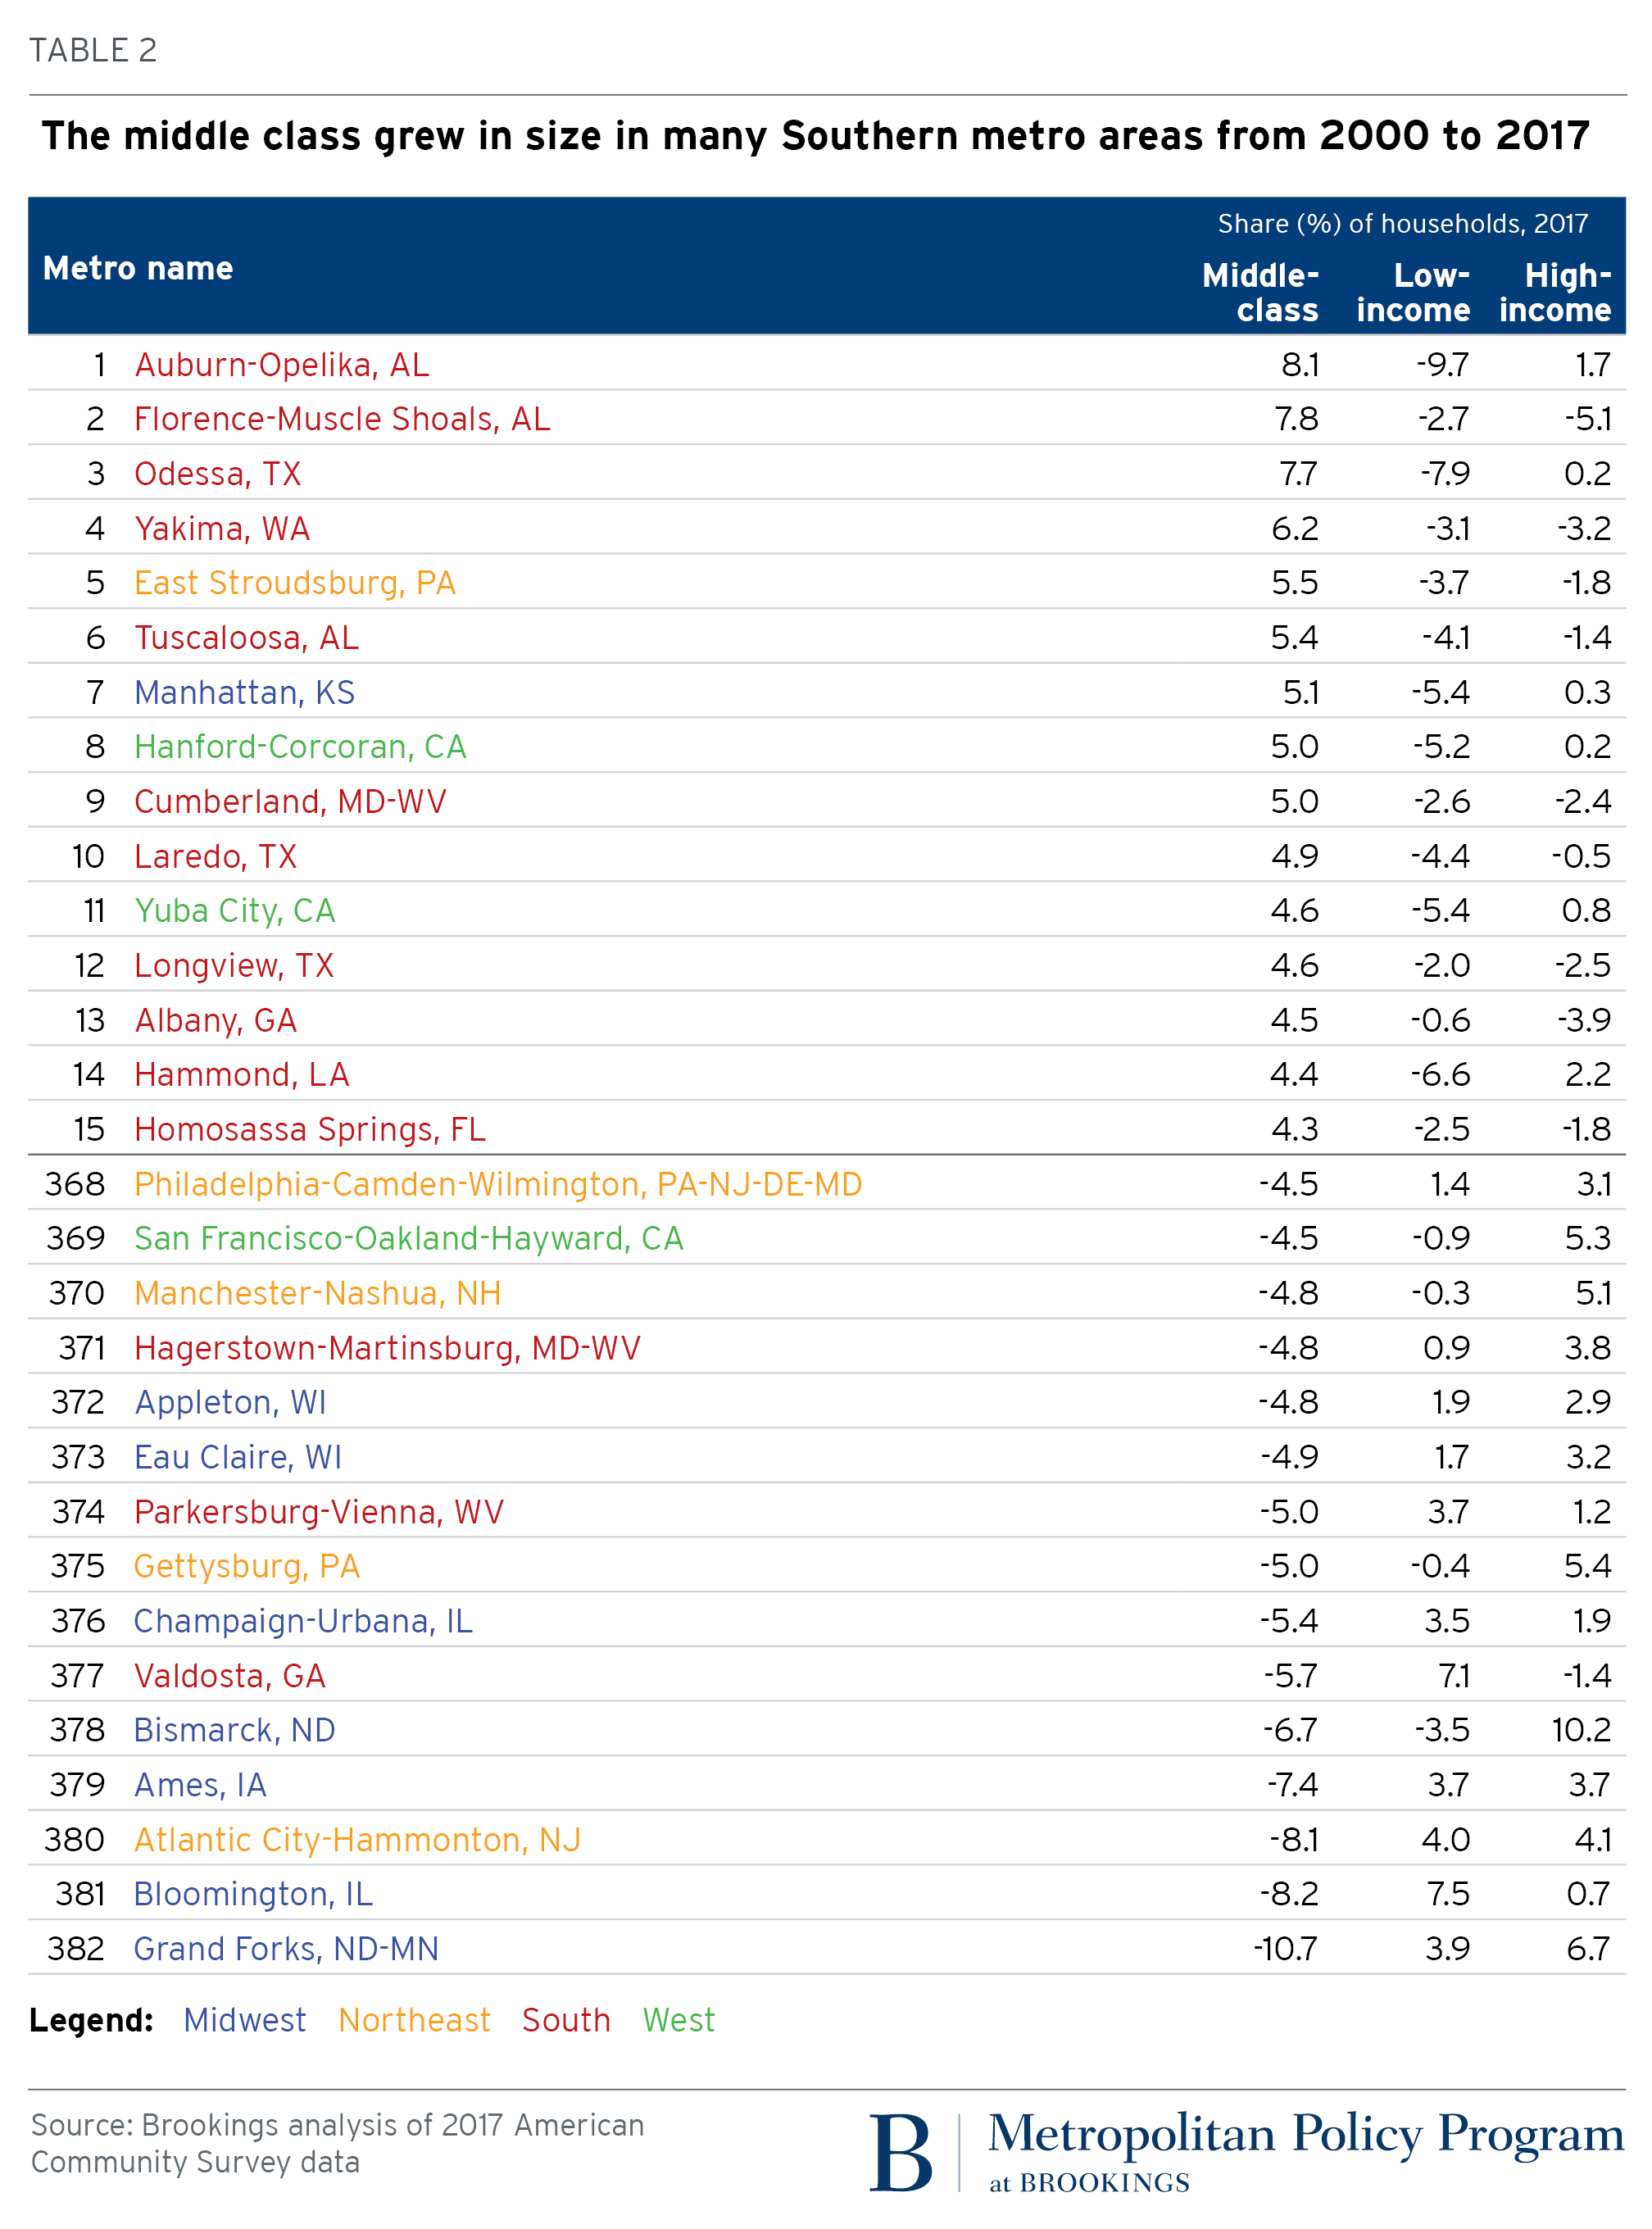
Many individual metropolitan areas, of course, experienced more significant changes in the size of their middle classes, from an 11 percentage-point drop (Grand Forks, N.D.) to an 8.1 percentage-point increase (Auburn, Ala.) (Table 2).
Table2
CHANGES IN METRO MIDDLE CLASS SIZE USUALLY REFLECTED EXPANDING HIGH-INCOME POPULATIONS
Hasil gambar untuk Where does the American middle class live?
As the above examples suggest, metro areas that experienced the largest expansions or contractions in their middle classes had mixed fortunes. In some, a gain in middle-class size seemed to reflect upward mobility for previously low-income households, while in others it reflected downward mobility for once-high-income workers. Similarly mixed dynamics characterized metro areas in which the middle class shrank.
In general, however, patterns of growth and decline in metro areas’ middle classes from 2000 to 2017 seemed more likely to reflect positive than negative momentum for local households. To illustrate this, Figure 3 sorts the 382 metro areas into four quadrants. In the quadrant with the largest number of metro areas (124), the middle class shrank, but the change in share of households with high incomes exceeded the change in the share with low incomes. This was the pattern noted above for San Francisco and Bismarck, N.D. In the quadrant with the second-highest number of metro areas (99), the middle class grew, while again the change in high-income share exceeded the change in low-income share. Auburn, Ala. and Odessa, Texas fit this pattern. The quadrant with the fewest number of metro areas (68) represented places in which the middle class shrank and low-income household growth predominated—economically struggling metro areas like Bloomington, Ill. and Valdosta, Ga.
Fig3
WHAT THE MIDDLE CLASS IN METRO AREAS TELLS (AND DOESN’T TELL) US 
As is true with most socioeconomic phenomena, how we choose to define the middle class has important implications for what we conclude about it. The definition employed here is an expansive one; it includes three in five households nationwide. A narrower definition, one anchored more strongly to local conditions, or one based on a concept other than income (e.g., occupation or educational attainment) might yield a different geography of the American middle class. This approach nonetheless suggests a few important takeaways about where the middle class lives, how that may be changing, and what it means:
  • The presence of the middle class varies considerably across U.S. metro areas. National policies aimed at improving the conditions of the middle class, and helping more people rise to join its ranks, will thus impact metropolitan areas differently. In this way, “people-based” interventions (like the Earned Income Tax Credit or Medicaid) have important placed-based effects.
  • Some factors associated with the local size of the middle class are relatively fixed. For instance, newer metropolitan areas in the South and West developed as larger, more suburban places that incorporate more middle-class communities than older metro areas in the Northeast and Midwest. Regional benchmarks could be more useful than national ones in assessing the size of a given metro area’s middle class.
  • As other local factors change over time, they may change the size of the middle class with them. Certain aspects of metro areas’ demographic and industrial structures are closely associated with the presence—or absence—of the middle class. These associations may help local policymakers better understand the sectors most likely to provide middle-class jobs, or the population groups most likely to hold them.
  • Middle classes have grown and declined in metro areas over time—often by considerable degrees—but have done so for very different reasons. To the extent the American middle class possesses a common set of assets, and faces a common set of challenges, changes in the size of the middle class locally over time may bring those assets and challenges into sharper or weaker focus. Yet researchers and policymakers should more deeply examine middle-class conditions at the local level to truly understand and improve middle-class resilience.
A supporter of President Muhammadu Buhari points at police officers during a rally in support of his administration in Nigeria.

Should the law be used to curb hate speech in Nigeria?

A new bill in Nigeria prescribes death by hanging to anyone found guilty of hate speech that results in the death of another person. But beyond simply changing the law, Jideofor Adibe argues it will take efforts from all sections of society to address the growing problem of hate speech in such a heterogeneous and polarized country.
Offensive and hateful speech has been a challenge in Nigeria. If it has to do with the Nigerian Civil War, Igbo nationalists take offense with the rest of the country; if it is about Boko Haram and its alleged sponsors, self-appointed defenders of the North are up in arms with equally self-appointed defenders of the South; if it has to do with resource control and oil politics, the Northsquares off against the South. The Igbos and the Yoruba, rival major ethnic groups, frequently pick on each other.
Hasil gambar untuk Should the law be used to curb hate speech in Nigeria? GIF
Hate and offensive speech profiling reached a pinnacle in the country in June 2017, when a coalition of Northern youth groups issued a Kaduna Declaration which, apart from calling the Igbos unprintable names, gave all Igbos in the North three months (until October 1, 2017) to leave. The reaction stemmed from harsh pro-Biafra rhetoric of Nnamdi Kanu, leader of the Indigenous People of Biafra. While it is true that Nnamdi Kanu had engaged in a form of rhetoric offensive to many people, the quit notice given to the Igbos in the North triggered competitive quit notices to vacate.
Though the notices were later withdrawn, they led to palpable fears that the situation could degenerate to a Rwanda-like genocide unless the tide of free-flowing offensive and hate speech in the country was stemmed.
IMPACT OF HATE SPEECH ON SOCIETY
In a heterogeneous and polarized country like Nigeria, hate speech threatens the nation-building process by widening the social distance among Nigerians, cementing existing distrust, and undermining national support. Hate speech can also negatively affect the economy. For instance, in the face of the quit notice given to the Igbos in northern Nigeria, some Igbo businessmen refused to entertain any credit request from customers, Igbos and non-Igbos alike, until after the October 1 deadline. Further, deposit money banks, already risk averse from high non-performing loans, became even more unwilling to lend during the quit notice period. The competitive quit notice, respectively given to the Igbos living in the North and the Northerners and Yorubas living in the Niger Delta, could curtail the willingness of Nigerians to invest in the regions other than their own because of the risk of future quit notices.
THE HATE SPEECH BILL AND ITS CRITICS
Hasil gambar untuk Should the law be used to curb hate speech in Nigeria? GIF
Several organizations such as the Ijaw Youth Council, the International Press Centre, and the Punch newspaper as well as eminent Nigerians such as Senator Shehu Sani have condemned the bill on several grounds:
Problem of definition
One of the criticisms is that the bill poorly defines hate speech, especially when differentiating between hate speech and offensive speech. Though hurtful, offensive speech is believed to be a protected freedom of expression, a critical component of a functioning democracy. Instead, the bill essentially regards even insulting or abusive speeches as hate speech, a vague and dangerous categorization. Defining hate speech in a way that delineates it from offensive speech has been a tall task for policymakers and academics around the world—including Susan Benesch at Harvard, former U.S. Supreme Court Justice Oliver Wendell Holmes, and many others. Some believe that the term “hate speech” should only be used for extreme cases such as speeches that explicitly call for the physical injury or extermination of certain people.
Attack on free speech
Another criticism of the bill is that it could provide a cover for the government to attack free speech, which in a democracy, is important both for prevalence of truth and for citizens to effectively participate in the democratic process. Hate speech laws have been used to suppress and punish left-wing viewpoints in Europe. Similarly, South Africa’s hate crimes bill has been criticized for being vulnerable to abuses that would undermine free speech.
HATE SPEECH LAWS AROUND THE WORLD
Apart from criticisms of the language of the bill, the effectiveness of such a law is questionable. In countries like France, the United Kingdom, and the Netherlands, offensive and hate speeches are prohibited by law. In contrast, laws prohibiting hate speech are unconstitutional in the United States. In U.S. courts, even “fighting words,” categorically excluded from the protection of the First Amendment, are not easy to separate from hate speech.
THE WAY FORWARD
Hasil gambar untuk Should the law be used to curb hate speech in Nigeria? GIF
A starting point is to recognize that the line between offensive and hate speech is often blurred. While proper hate speech—what I define as presenting “clear and imminent danger” of triggering violence—should be criminalized (but certainly not with death penalty), non-legal instruments would be more effective in a polarized society like Nigeria to deal with offensive and other hurtful speech forms. In this respect, a taxonomy of what constitutes hate and offensive speeches would be good foundation. Media organizations through their unions should then be urged to incorporate these as part of good journalistic practice and impose sanctions on erring members.
Perhaps one of the most effective ways of combating hate speech would be to marginalize purveyors of such speeches. In the U.K., while far-right, fascist parties like the British National Party and the racist ideas they support are not banned, mainstream British politician avoid associating openly with members of such parties. In Nigeria, on the other hand, offensive and hate speech mongers are often seen as regional and ethnic heroes.
Nigerians should also learn to laugh at themselves. This is already happening in some ways with the country’s comedians who dish out jokes breaking down the lines of ethnic and regional profiling, showing that every ethnic group is both a victim and a victimizer.
The National Orientation Agency—responsible for communicating government policy and promoting patriotism—in concert with civil society groups and community leaders, should also embark on a campaign against the use of hate speech. In the same vein, internet service providers should be encouraged to bring down blogs and websites they host which publish, promote, or provide unfettered space for the expression of hate and offensive speeches. Put simply, more than just changing the law, it will take efforts from all sections of society—government, media, business, community leaders, civil society, and more—to curb the influence of hate speech in Nigeria.
MHI Brooking LOGO MEDIA HUKUM INDONESIA 01

Tidak ada komentar:

Posting Komentar


Postingan Terupdate

Sidang Perkara No. 14/PUU-XXII/2024, Ahli : Sebagian Besar Notaris Berusia 70 Tahun Masih Kompeten Menjalankan Tugas

JAKARTA, MHI – Sidang permohonan uji materiil Pasal 8 ayat (1) huruf b dan Pasal 8 ayat (2) Undang-Undang Nomor 30 Tahun 2004 tentang Jabata...

Postingan Terkini

Pilihan Redaksi